 BxBChan Release Test Deep Dive
BxBChan Release Test Deep Dive
BxBChan Release Test Deep Dive
This deep dive discusses BxBChan release tests.
These tests fulfill multiple purposes. First, some test for proper operation with pass/fail tests. Second, they have visual graphs as outputs that give human-verifiable results. Third, they can be run at a customer site to verify proper operation with customer tools. Fourth, they give information on BxBChan performance. Fifth, they serve as examples for how customers can use the BxBChan core and how customers can make their own performance measurements.
This deep dive specifically shows the human-verifiable graphical results that are included with each BxBChan core.
For small BxBChans, all of these tests are run on both RTL and netlist. For larger BxBChans, all tests are run on the RTL, but the netlist tests take an unacceptable amount of time. Thus for them only the quickest sine test is run.
There are also other graphical results included with a BxBChan core that are intended for filter selection rather than as release tests. Those are discussed in the BxBChan Customization Deep Dive.
The frequency response of the BxBChan with its default filter is
given in this test. 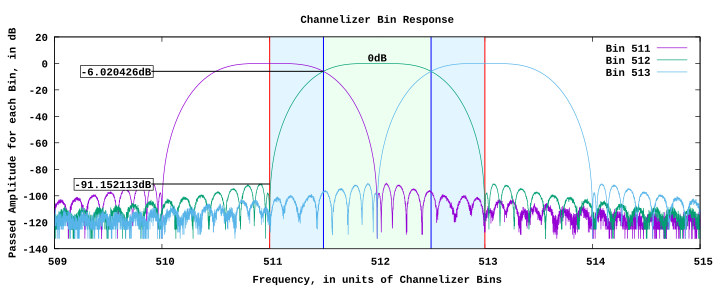 This graph clearly shows the crossover point between
channels, which is the dividing line between the green and blue
areas. It also clearly shows the folding point, which is the
dividing line between the blue and white areas. For this channel,
the green area is the passband. The blue area is the transition
band. The white area is the stopband. Several of the important
points have their dB measurements labeled.
This graph clearly shows the crossover point between
channels, which is the dividing line between the green and blue
areas. It also clearly shows the folding point, which is the
dividing line between the blue and white areas. For this channel,
the green area is the passband. The blue area is the transition
band. The white area is the stopband. Several of the important
points have their dB measurements labeled.
This graph is quite distinctive, and generally shows very high levels of signal rejection in the stopband. It is thus easy to spot even small errors in performance levels.
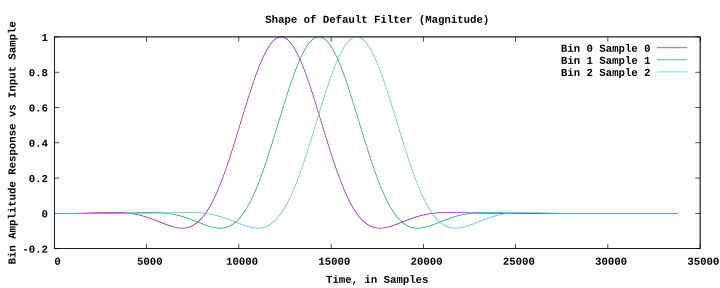
The time response of the BxBChan with its default filter is given in
this test. The time response has two components, magnitude and
phase. These are in separate graphs. Here is the magnitude:
 Here is the phase:
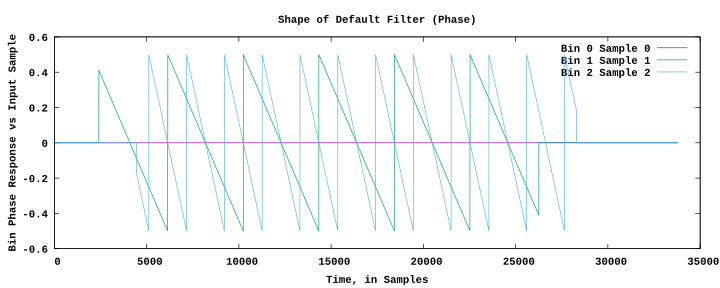 When the amplitude is too low, phase is indeterminant. Thus the
phase plot sometimes has dropouts. This is normal.
When the amplitude is too low, phase is indeterminant. Thus the
phase plot sometimes has dropouts. This is normal.
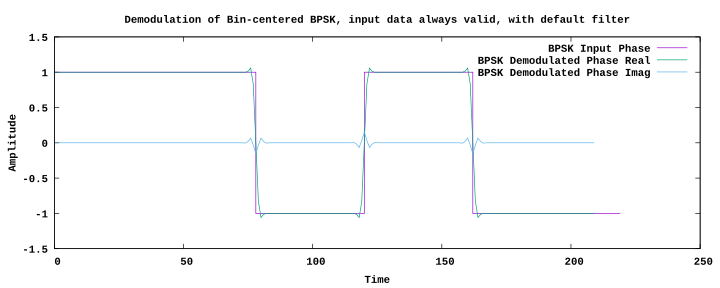
This test verifies the behavior of the BxBChan over a stretch of
time. It creates a BPSK signal modulated to be centered in a single
channel, and then uses the BxBChan to automatically demodulate that
channel. There are two versions of this test. One also verifies
that the flow control works.
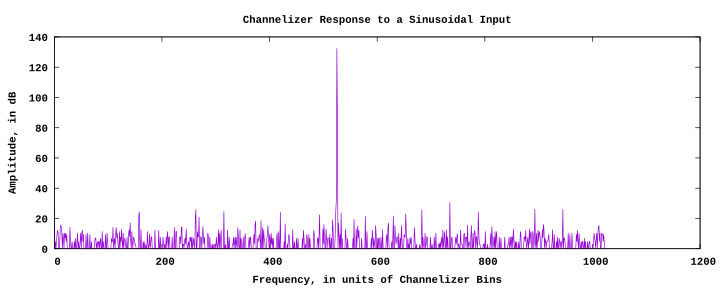
This test that a sine wave in produces a single spike in the output.
This is the most useful test in debugging, primarily because it is
the fastest to run and catches most simple errors. Other tests take
considerably longer to debug because of the long wait time for them
to run. For netlist tests of long BxBChans, tests are so slow that
this is the only one that can be practically run.
This test shows the passband ripple when 3dB-down BxBChans are
paired with 3dB-down BxBDechans for reconstruction. The filters are
designed for this function, so performance is generally extremely
good. 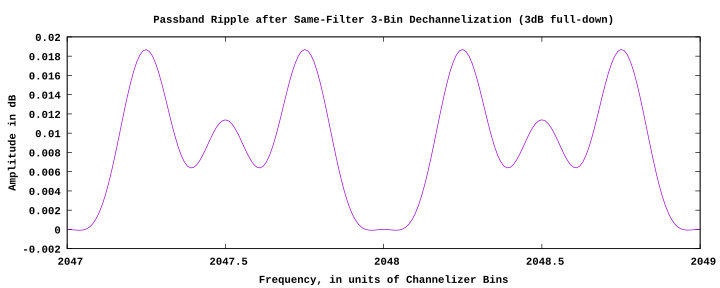
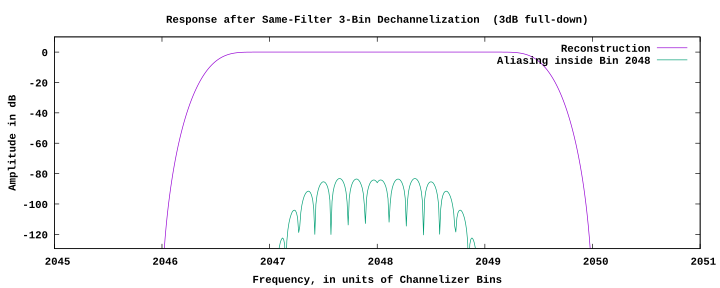
This test shows the in-band aliasing when 3dB-down BxBChans are
paired with 3dB-down BxBDechans for reconstruction. In this case,
three channels are reconstructed. The green curve shows aliasing
levels. This graph can be somewhat misleading, since all components
of aliasing are not accounted for.
The BxBChan ships with a number of good tests that show its correct operation and performance. The tests also act as examples of how to operate and test the BxBChan.
The number of tests has grown to cover all failure modes that are anticipated or have been seen.